22. ch02. seaborn - 07. distplot, hist - 23. ch02. seaborn - 08. heatmap
22. ch02. seaborn - 07. distplot, hist
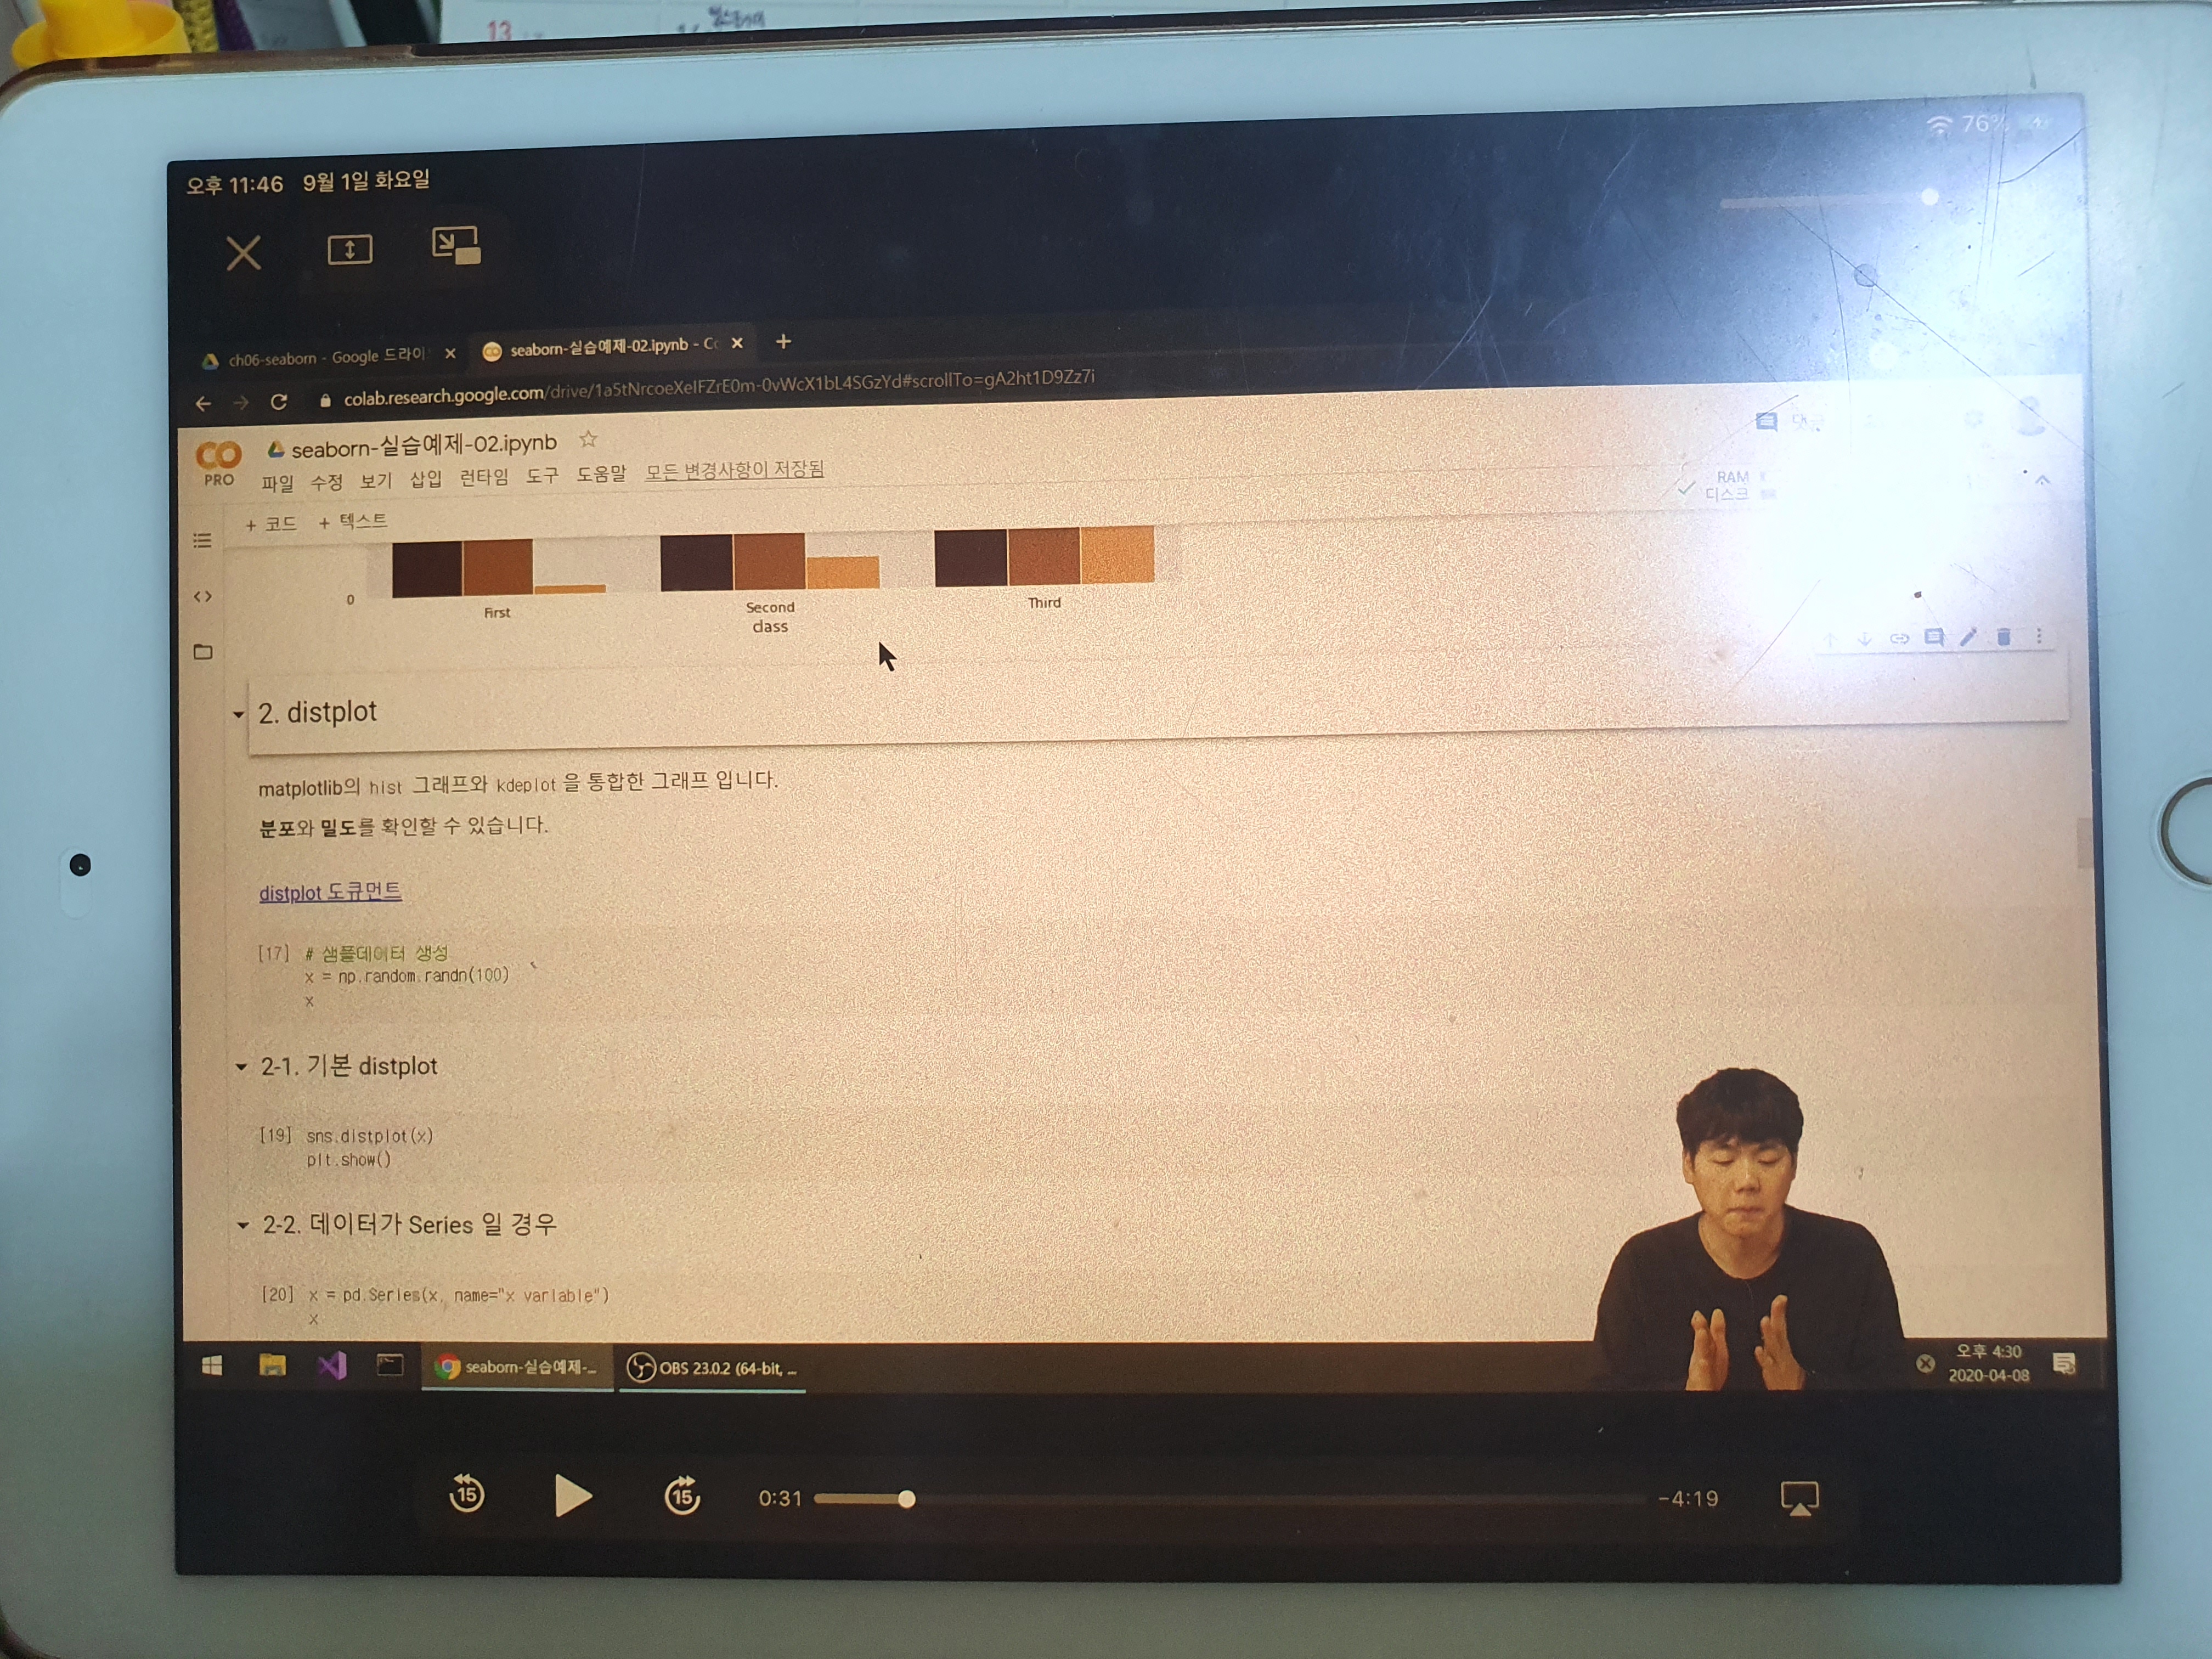
2. distplot
matplotlib의 hist 그래프와 kdeplot을 통합한 그래프
분포와 밀도를 확인
# 샘플데이터 생성
x = np.random.randn(100)
x
2-1. 기본 distplot
sns.distplot(x)
plt.show()
2-2. 데이터가 Series 일 경우
x = pd.Series(x, name="x variable")
x
sns.distplot(x)
plt.show()
2-3. rugplot
rug는 rugplot이라고도 불리우며, 데이터 위치를 x축 위에 작은 선분(rug)으로 나타내어 데이터들의 위치 및 분포
sns.distplot(x, rug=True, hist=False, kde=True)
plt.show()
2-4. kde (kernel density)
kde는 histogram보다 부드러운 형태의 분포 곡선
sns.distplot(x, rug=False, hist=False, kde=True)
plt.show()
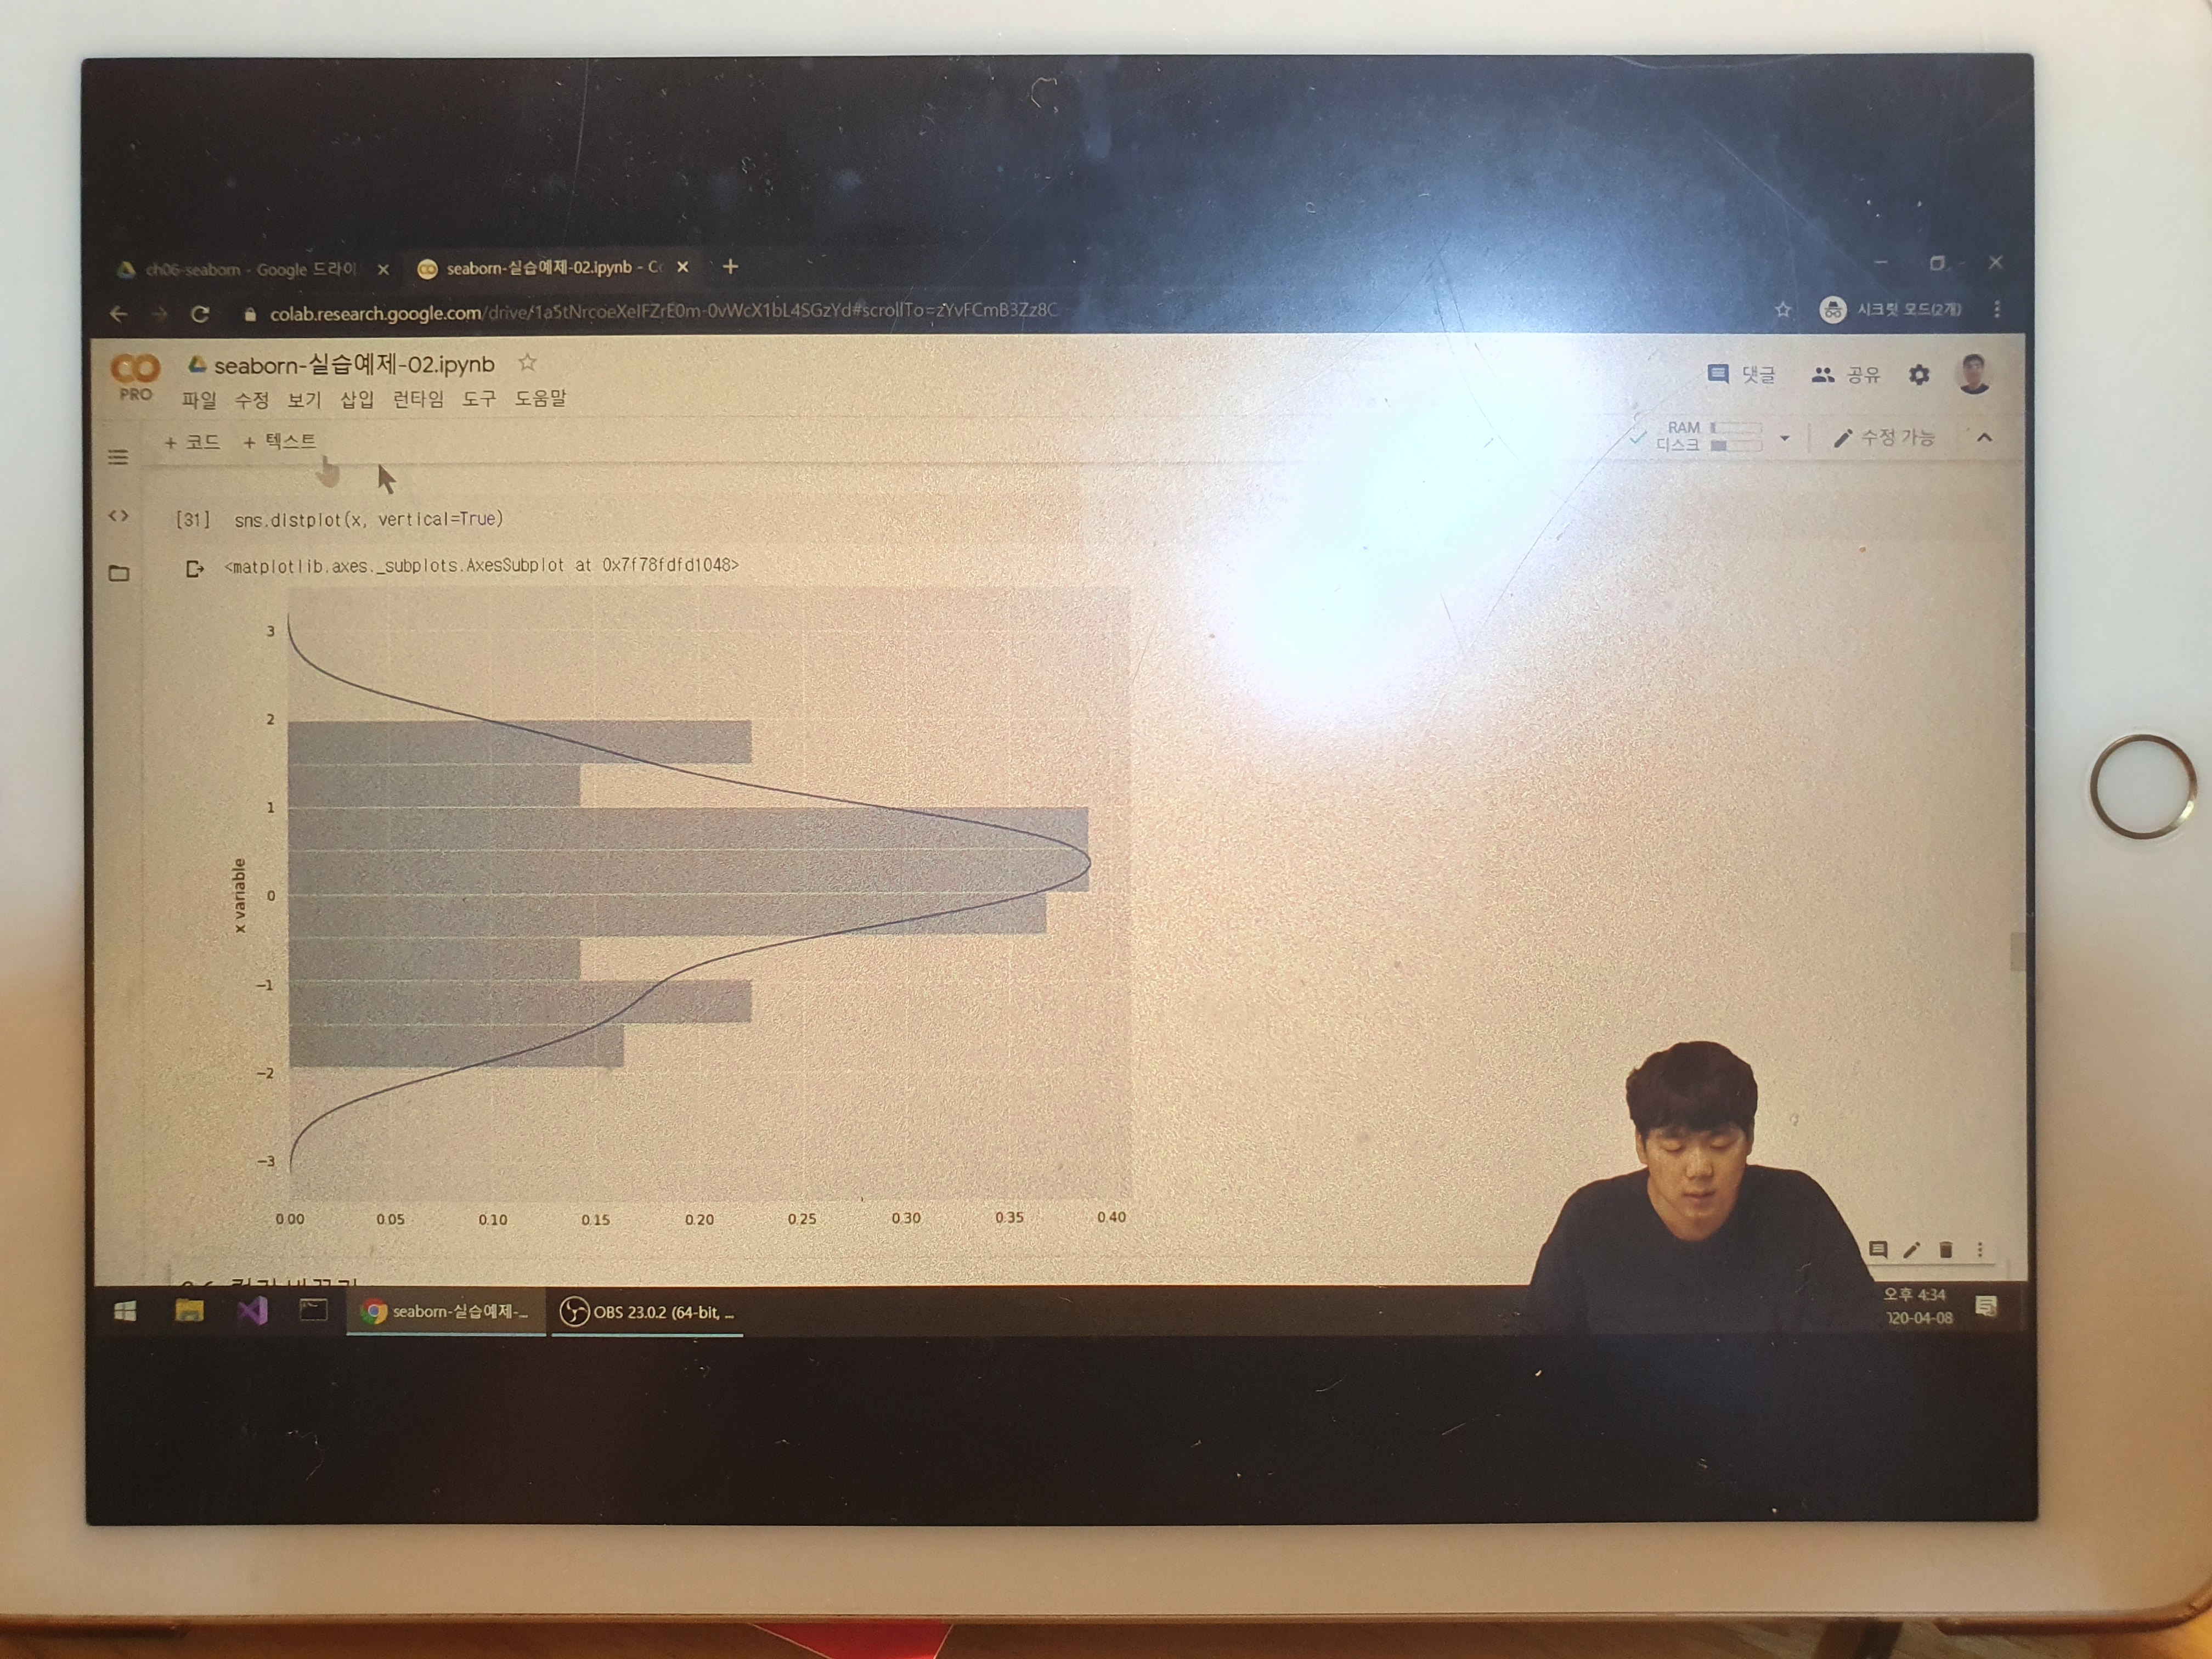
2-5. 가로로 표현하기
sns.distplot(x, vertical=True)
2-6. 컬러 바꾸기
sns.distplot(x, color="y")
plt.show()
23. ch02. seaborn - 08. heatmap
3. heatmap
3-1. 기본 heatmap
uniform_data = np.random.rand(10, 12)
sns.heatmap(uniform_data, annot=True)
plt.show()
3-2. pivot table을 활용
tips
pivot = tips.pivot_table(index='day', columns='size', values='tip')
pivot
sns.heatmap(pivot, cmap='Blues', annot=True)
plt.show()
3-3. correlation(상관관계)를 시각화
corr() 함수는 데이터의 상관관계
titanic.corr()
sns.heatmap(titanic.corr(), annot=True, cmap="YlGnBu")
plt.show()
패스트캠퍼스 데이터분석 강의 링크
bit.ly/3imy2uN


